In the information age, data is power. Businesses that effectively collect, analyze, and activate insights from data are poised for smarter decision making and strategic growth.
However, with ever-expanding volumes of information, making sense of data can seem overwhelming. Questions abound: Where do we start? What data matters? How do we extract real-world impact?
Fear not! This definitive guide empowers you to harness the potential of data analytics to propel your business forward. From defining goals to activation tactics, we break down the key steps for wringing powerful insights from information.
Chart the Course: Define Your Goals and Questions
Before diving into the data, clearly define your destination. Establish specific business objectives you seek to inform through data analysis. Dig into overarching questions you want the answers to.
For instance, goals might include:
- Optimizing marketing campaign performance
- Enhancing customer segmentation
- Identifying new market opportunities
- Streamlining operations
- Personalizing customer experiences
Laser-focused goals guide your data collection and prevent analysis paralysis. Always tie analysis back to tangible business impact to extract maximum value.
Cast the Net: Implement Data Collection Strategies
Next, identify relevant data sources to meet your analytical goals. Employ a multi-pronged approach across both internal records and external signals:
Internal Data Collection
- Sales and CRM data – transaction history, customer interactions, marketing metrics
- Operational records – inventory, purchasing, employee and cost info
- Website analytics – traffic patterns, behavior flows, referrers
- Customer feedback – ratings, reviews, support tickets, surveys
External Data Signals
- Industry benchmarking data – market reports, competitor analysis
- Third-party data – demographic info, firmographic segmentation
- Social listening data – brand mentions, customer sentiment
Supplement internal metrics with outside signals for enhanced context. Additionally, directly engage customers through interviews, focus groups, surveys and feedback channels.
Throughout your collection strategy, emphasize data quality. Ensure accuracy, consistency, relevance and remove biases. Garbage in inevitably equals garbage out!
Data Wrangling: Cleansing and Preparation

Before analysis, thoroughly cleanse and prepare collected data. This process entails:
- Removing duplicate records
- Correcting errors and outliers
- Handling missing values
- Normalizing disparate data formats
- Integrating data from multiple sources
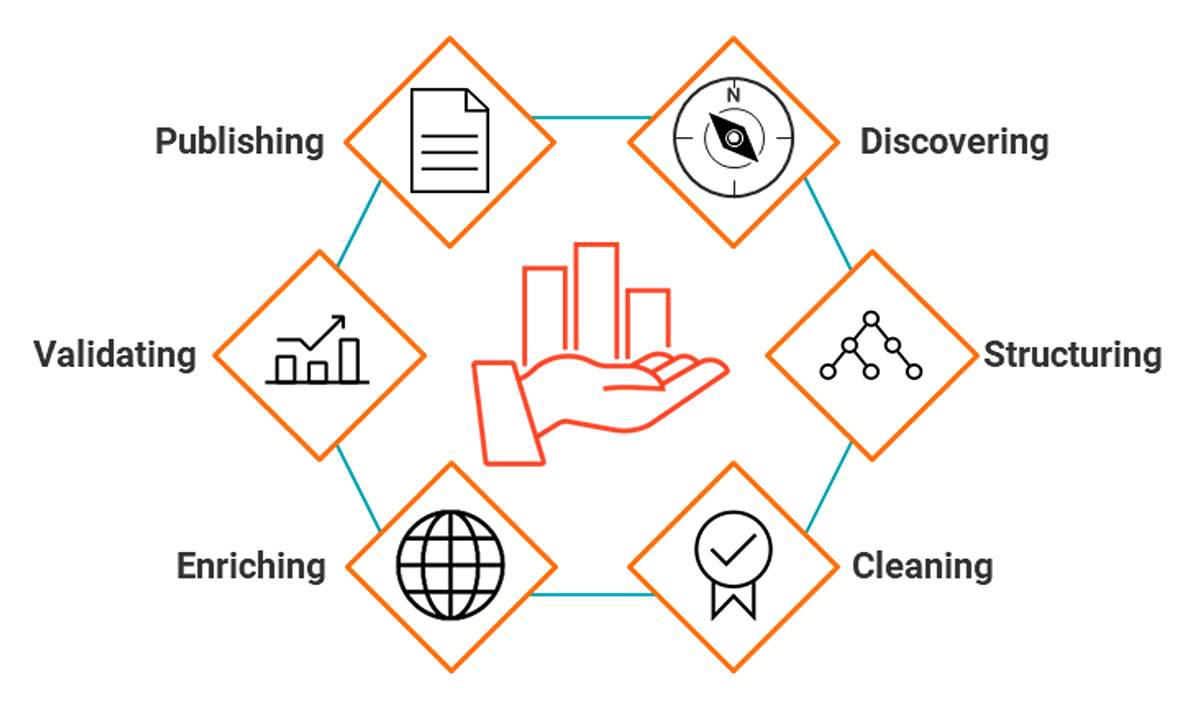
- Structuring and enriching data for analytical tools
Proper wrangling sets the stage for drawing accurate conclusions. Allow ample time for this crucial step.
Analyze and Explore: Make Sense of Data
Now we’re ready to dive into analysis! Uncover hidden insights within your prepared data set. Overarching techniques include:
Descriptive Analytics
Summarize overall trends through visualizations and statistical summaries like mean, distributions, and percentage breakdowns.
Diagnostic Analytics
Understand the root causes behind trends through techniques like drill-down, cohort analysis, and funnel visualization of behaviors over time.
Predictive Analytics
Identify likelihood of future outcomes with statistical modeling and machine learning algorithms applied to historical data.
Prescriptive Analytics
Take it a step further by determining the optimal decisions or actions suggested by your data insights. This involves techniques like simulation of business rules, optimization algorithms, and network graph analysis.
Choose techniques aligned to your business goals. Spreadsheets work for basic analysis while data science programming languages like Python and R are great for complex modeling.
Visualize Insights through Data Storytelling
Raw statistical outputs often fall flat with executives. Transform numbers into intuitive visuals to showcase insights. Strategically guide your audience through key findings with insightful narratives and impactful data visualization.
Tools like Tableau, Power BI, and Excel enable you to build engaging interactive reports, dashboards and infographics. Choose clear, focused chart types that resonate with stakeholders such as:
- Line and bar charts for trend analysis
- Scatter plots and heat maps to showcase correlations
- Pie charts to display proportional breakdowns
- Maps and geospatial patterns
Hone your data storytelling skills for maximum impact!
Activate Insights: Put Data into Action
Even the most brilliant analysis is worthless without activation. Now is the time to drive real business outcomes from your hard-won data revelations.
Demonstrate quick wins first to build momentum for data-driven decisions in your organization. Potential starting points include:
- Fine-tuning campaign messaging based on customer persona insights
- Doubling down on high-performing marketing channels
- Addressing workflow chokepoints surfaced through process analysis
- Optimizing prices based on elasticity revealed through experimental data
Build an activation roadmap tied to larger business objectives focusing on enhancements across:
- Customer targeting and messaging personalization
- Product and service offerings
- Business processes and operations
- Pricing and promotional strategies
- Distribution partnerships and channels
- Market segmentation and positioning
Continuously track the impact of data-driven decisions through real-world performance indicators. Feed insights back into your collection and analysis cycle for enhanced refinement.
Cultivate a Data-Driven Culture
Effectively leveraging data analytics is not a one-time initiative – it’s an always-on capability requiring company-wide commitment. Champion a data-driven culture within your organization through:
- Democratizing access to data and insights across all teams and roles
- Incentivizing data-informed testing and decision making
- Promoting multidisciplinary collaboration on business intelligence goals
- Investing in employee skills building on analytics and decoding data storytelling
- Continually enriching datasets and refinement of models
Stay nimble and keep pace with the rapid evolution of ever-more powerful data science capabilities – from machine learning predictive engines to AI-optimized decision support systems.
The Data-Driven Journey Never Ends
There you have it – a comprehensive playbook for harnessing data to drive smarter decisions and sustainable business growth. By closely tying analysis back to tangible goals, activating insights, and embedding an analytics culture across the organization – you’re on your way to becoming an industry leader.
Remember, in the data age, sitting still means falling behind. Continually refine your approach to stay competitive. Exponential technologies open up new realms of possibility – so never stop striving to extract powerful insights from ever-growing information streams!


Add Comment